All 4 sheets — Number, ratio and proportion, Algebra, graphs and sequences, Geometry, Pythagoras and trigonometry and Probability and statistics — for £3.99. One landscape page per topic,
every claim sourced and every image licensed.
4 sheets · one A4 landscape PDF each · instant download
Bought once for the set, not per sheet. Photocopy them for your classes freely — keep
the running foot on the page, which carries the image credits the licences require.
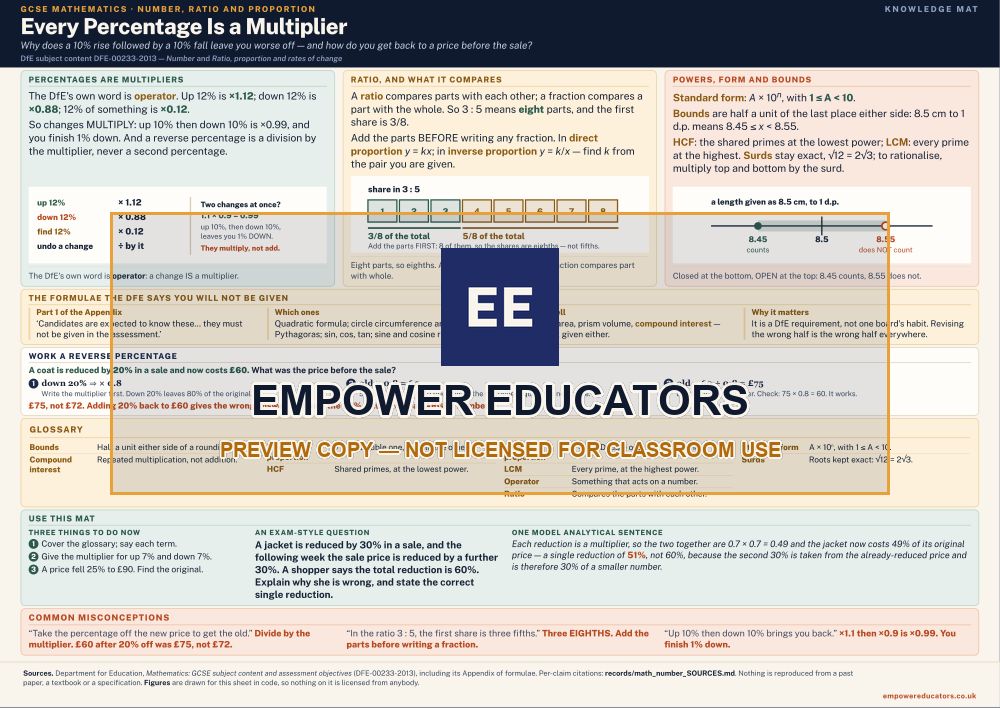
Why a 10% rise followed by a 10% fall leaves you worse off — and how to get back to a price before the sale. Percentages as multipliers; ratio and proportion with a bar model; standard form, bounds, HCF and LCM, and surds; the formulae the DfE says you will not be given; a worked reverse percentage. Ten terms to define, a model answer on two successive reductions, and the misconceptions that cost marks. No photographs: every figure is drawn for the sheet.
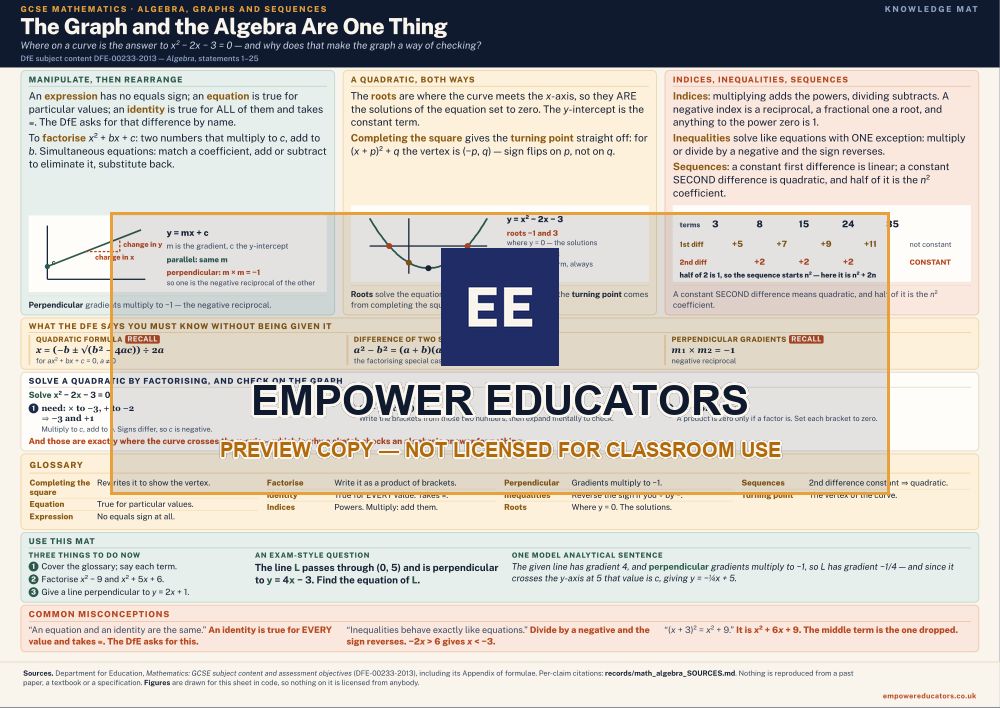
Where on a curve the answer to x² − 2x − 3 = 0 sits — and why that makes the graph a way of checking. Expressions, equations and identities; factorising, rearranging and simultaneous equations; a quadratic read both ways, roots to vertex; indices, inequalities and quadratic sequences with a second-difference figure; the three results you must know unprompted; a quadratic solved by factorising and checked on its graph. Eleven terms to define, a model answer on a perpendicular line, and the misconceptions that cost marks.
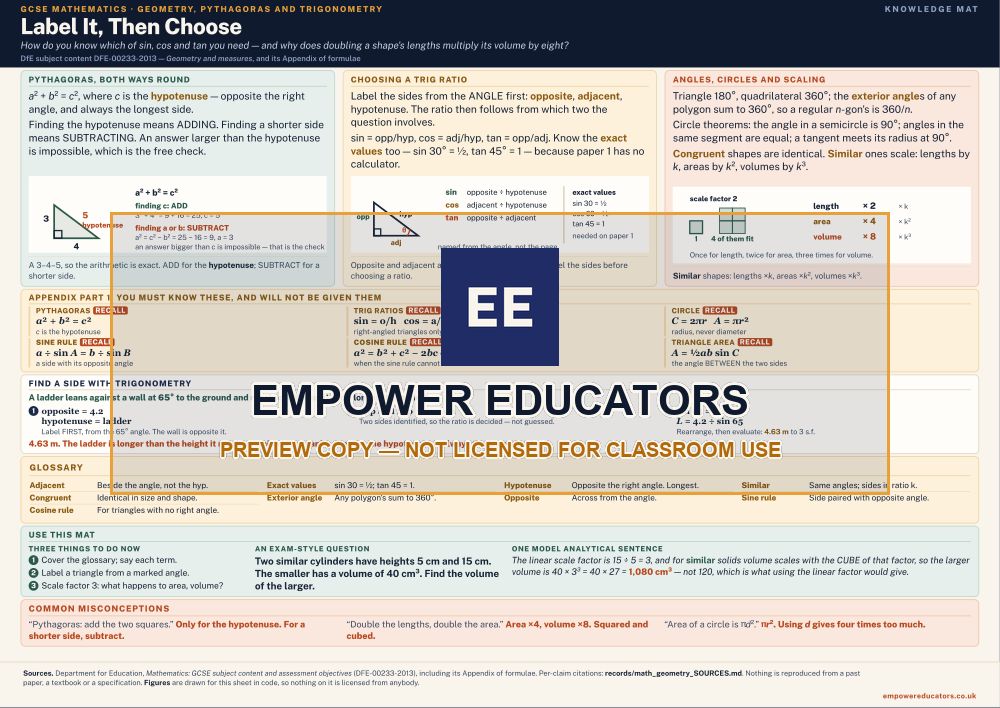
How you know which of sin, cos and tan you need — and why doubling a shape's lengths multiplies its volume by eight. Pythagoras both ways round; labelling a triangle from the angle and choosing a ratio, with the exact values Paper 1 expects; angle facts, three circle theorems and similar-shape scaling; the six Appendix results you must know unprompted; a ladder problem worked with trigonometry. Nine terms to define, a model answer on similar cylinders, and the misconceptions that cost marks.
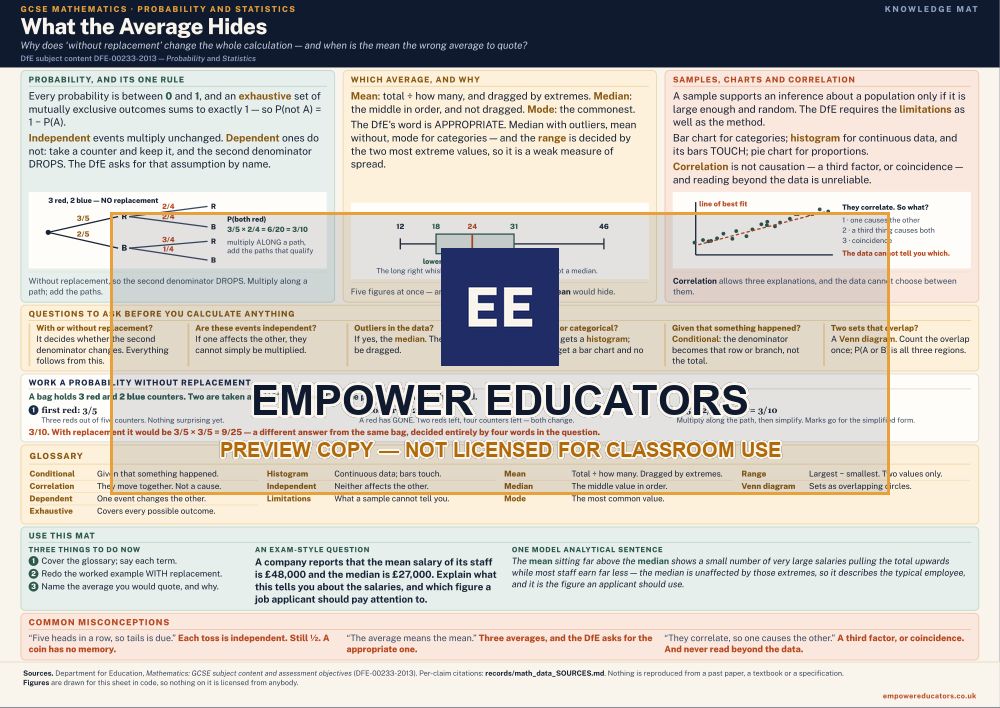
Why 'without replacement' changes the whole calculation — and when the mean is the wrong average to quote. Probability with a tree diagram drawn without replacement; which average and why, with a box plot; samples, charts, Venn diagrams and correlation; six questions to ask before you calculate anything; a worked probability without replacement. Twelve terms to define, a model answer on a mean far above a median, and the misconceptions that cost marks.
The previews above are the full sheets, watermarked. Where a sheet carries photographs,
every one is public domain worldwide or licensed CC BY, verified per image against the
licence itself rather than a label, and the running foot names every creator, records that
the images have been cropped and adjusted for print, and links the licence; figures are
drawn in code for the sheet, and extracts are written for it or verified against a
public-domain text. Nothing on any sheet is reproduced
from a past paper, a mark scheme, an examiner report or a specification, and Empower
Educators is not affiliated with any awarding body.
Cookies
This site works the same either way. Measurement — Google Analytics and Microsoft
Clarity — only runs if you say yes, and it is used to see which resources people
actually reach. What is collected.